
Overview
This project was a final class assignment for DS 4200 (Information Visualization & Data Analytics). The class focused on applying data cleaning, visualization best practices, and effective data storytelling. Core concepts involved data acquisition and cleaning, evaluating the most suitable visualization for a purpose using tools like Pandas, Altair, Tableau, and D3.js, and translating trends into clear insights. This assignment was completed in collaboration with my two partners, Rachel Elevathingal and Mahitha Gudipaty.
The Goals
This visualization project is centered on transforming e-commerce shopping data, specifically from Massachusetts, into clear, actionable business strategies.
We analyzed key aspects of customer behavior:
Spending Dynamics: Compare Massachusetts spending to other states, shopping frequency, and identify high-value product categories.
Promotion Efficacy: Determine how discounts affect customer spending and inform pricing strategies.
Product Optimization: Pinpoint the most popular product sizes and varieties for better inventory planning.
Targeted Marketing: Analyze age and gender correlations with shopping frequency to create customer segmentation.
About the Data
Source:
We are using a “Shopping Behaviours” dataset from Kaggle that was posted a month ago. The dataset provides information about consumer behavior and shopping habits across different demographics, locations, and product categories.
Size:
It includes 3,900 customer records with 18 attributes describing purchase details, shopping tendencies, and feedback.
Key Attributes:
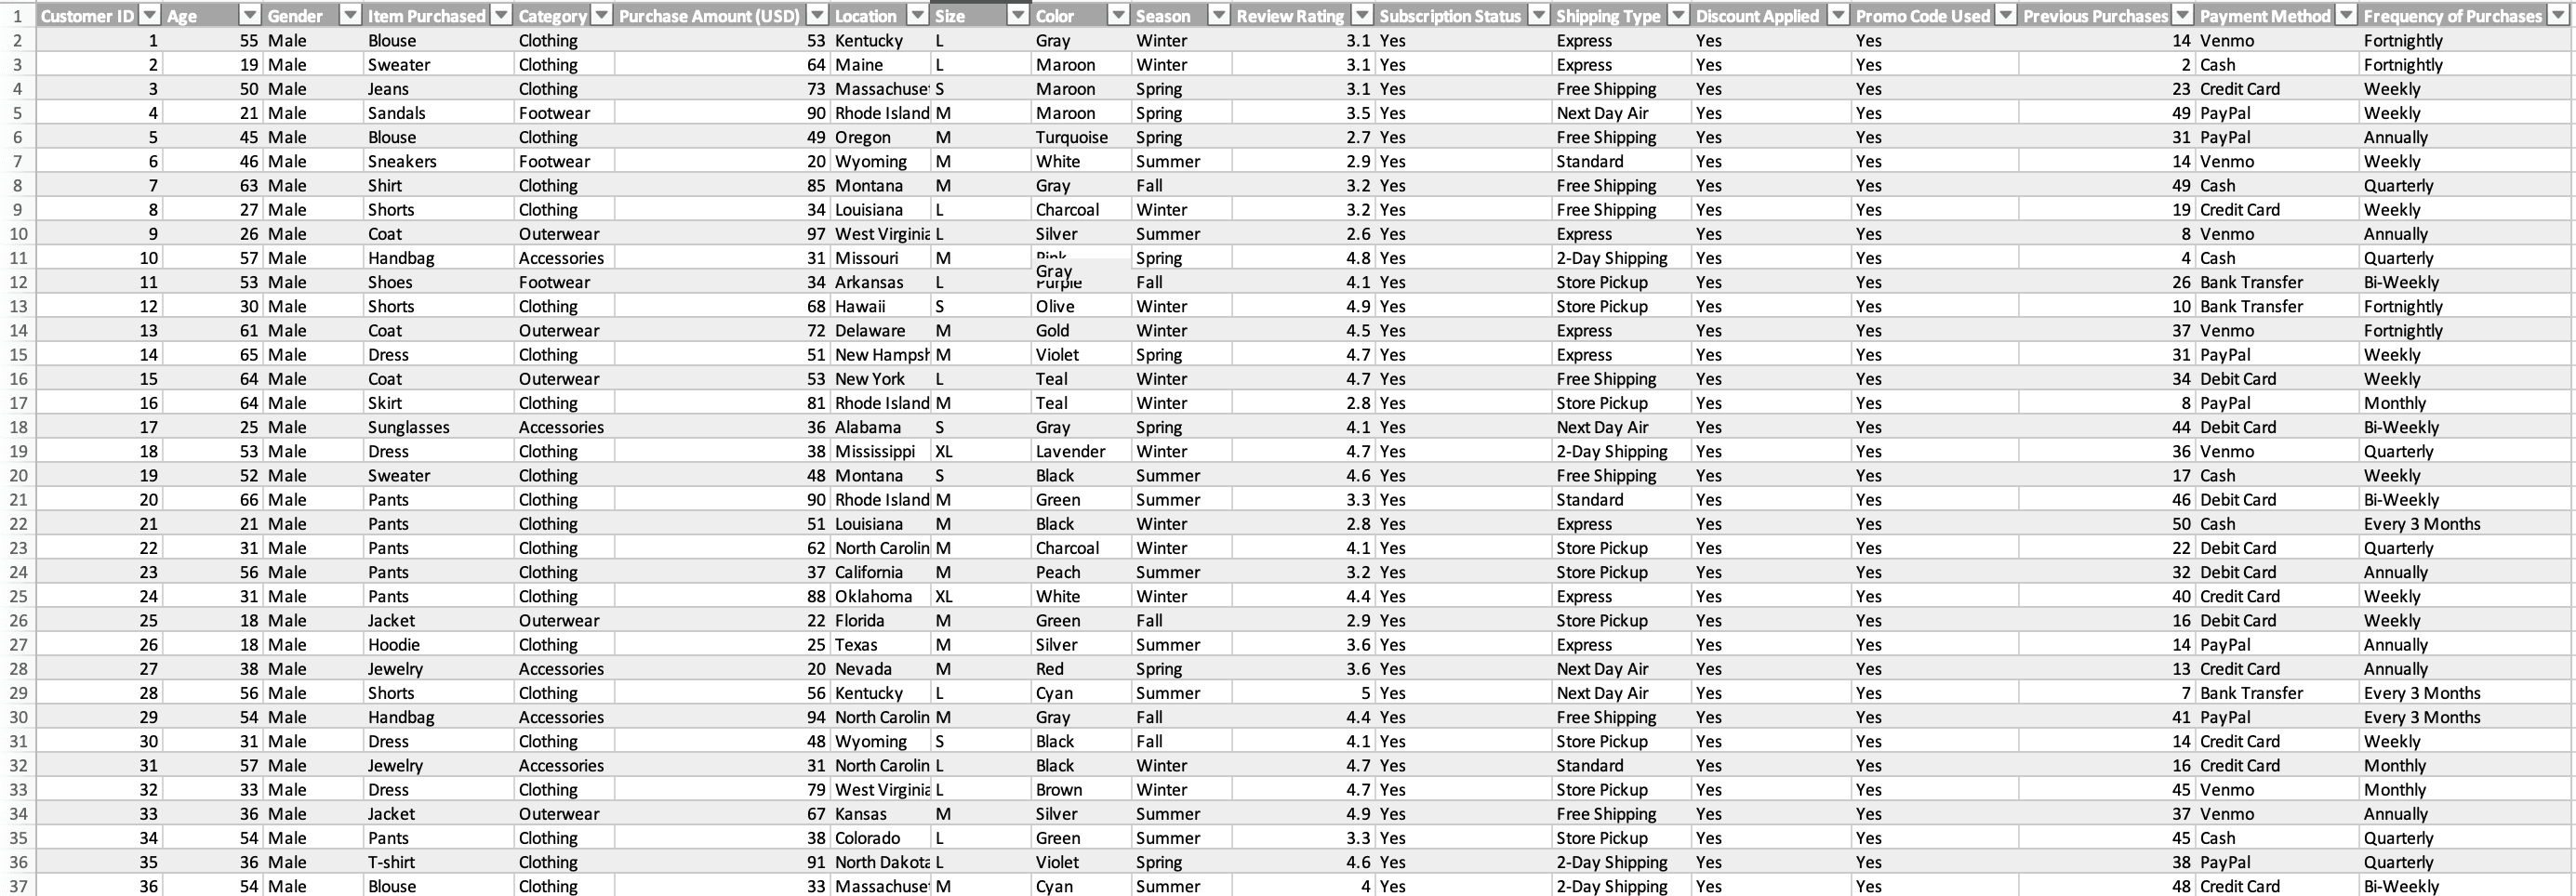
Customer ID (int), Age (int), Gender (string), Item Purchased (string), Category (string), Purchase Amount (USD) (int), Location (string), Size (string), Color (string), Season (string), Review Rating (float64), Subscription Status (string), Shipping Type (string), Discount Applied (string), Promo Code Used (string), Previous Purchases (int), Payment Method (string), Frequency of Purchases (string)
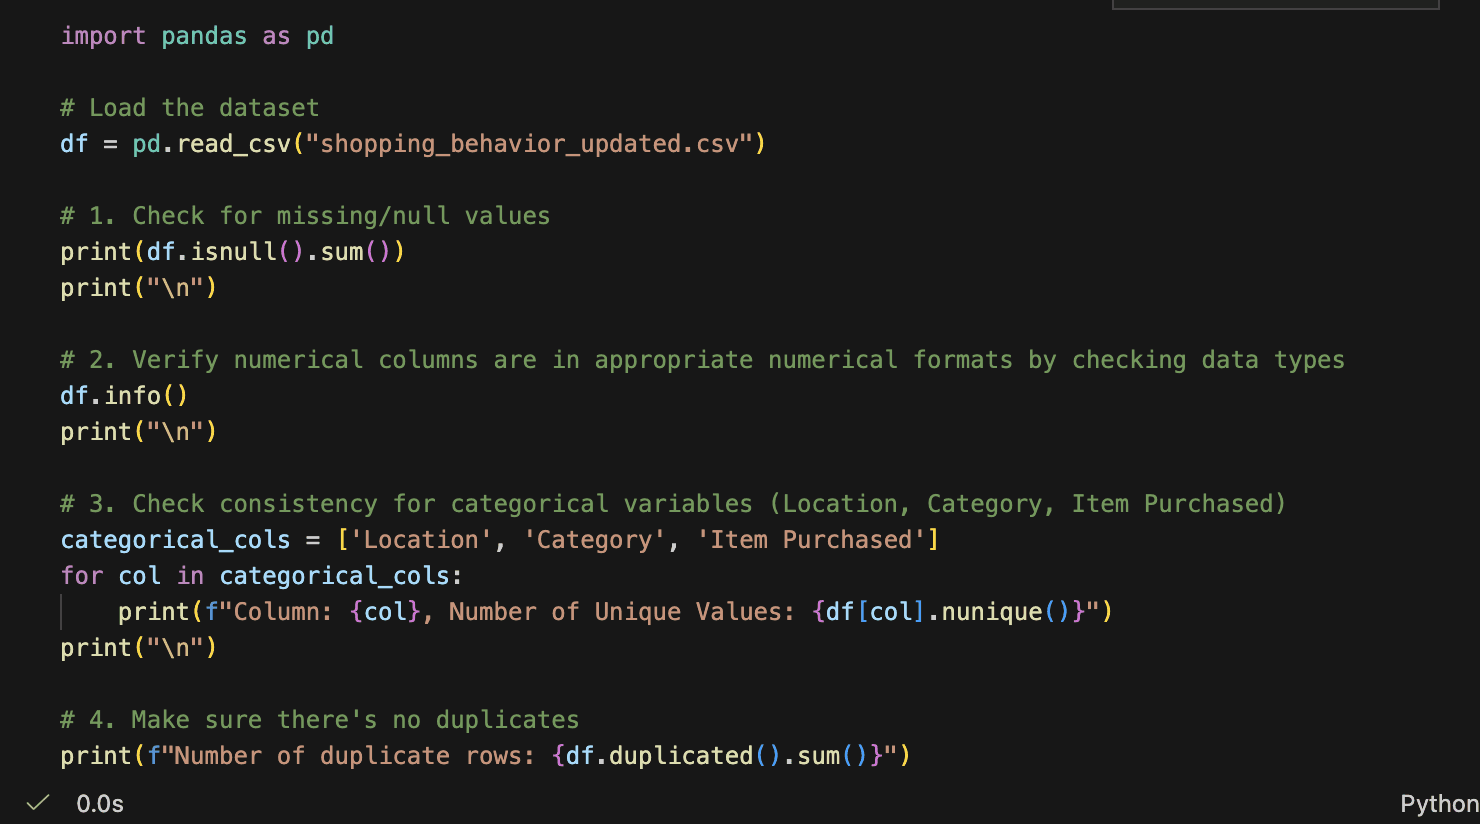
Pre-Processing:
First, we handled missing and null values. Next, we verified that numerical columns like Age, Purchase Amount (USD), and Review Rating were already in appropriate numerical formats. We then checked and confirmed that categorical variables such as Location, Category, and Item Purchased were consistently formatted. Finally, we ensured there were no duplicates.
Visualizations
US States' Purchasing Amounts
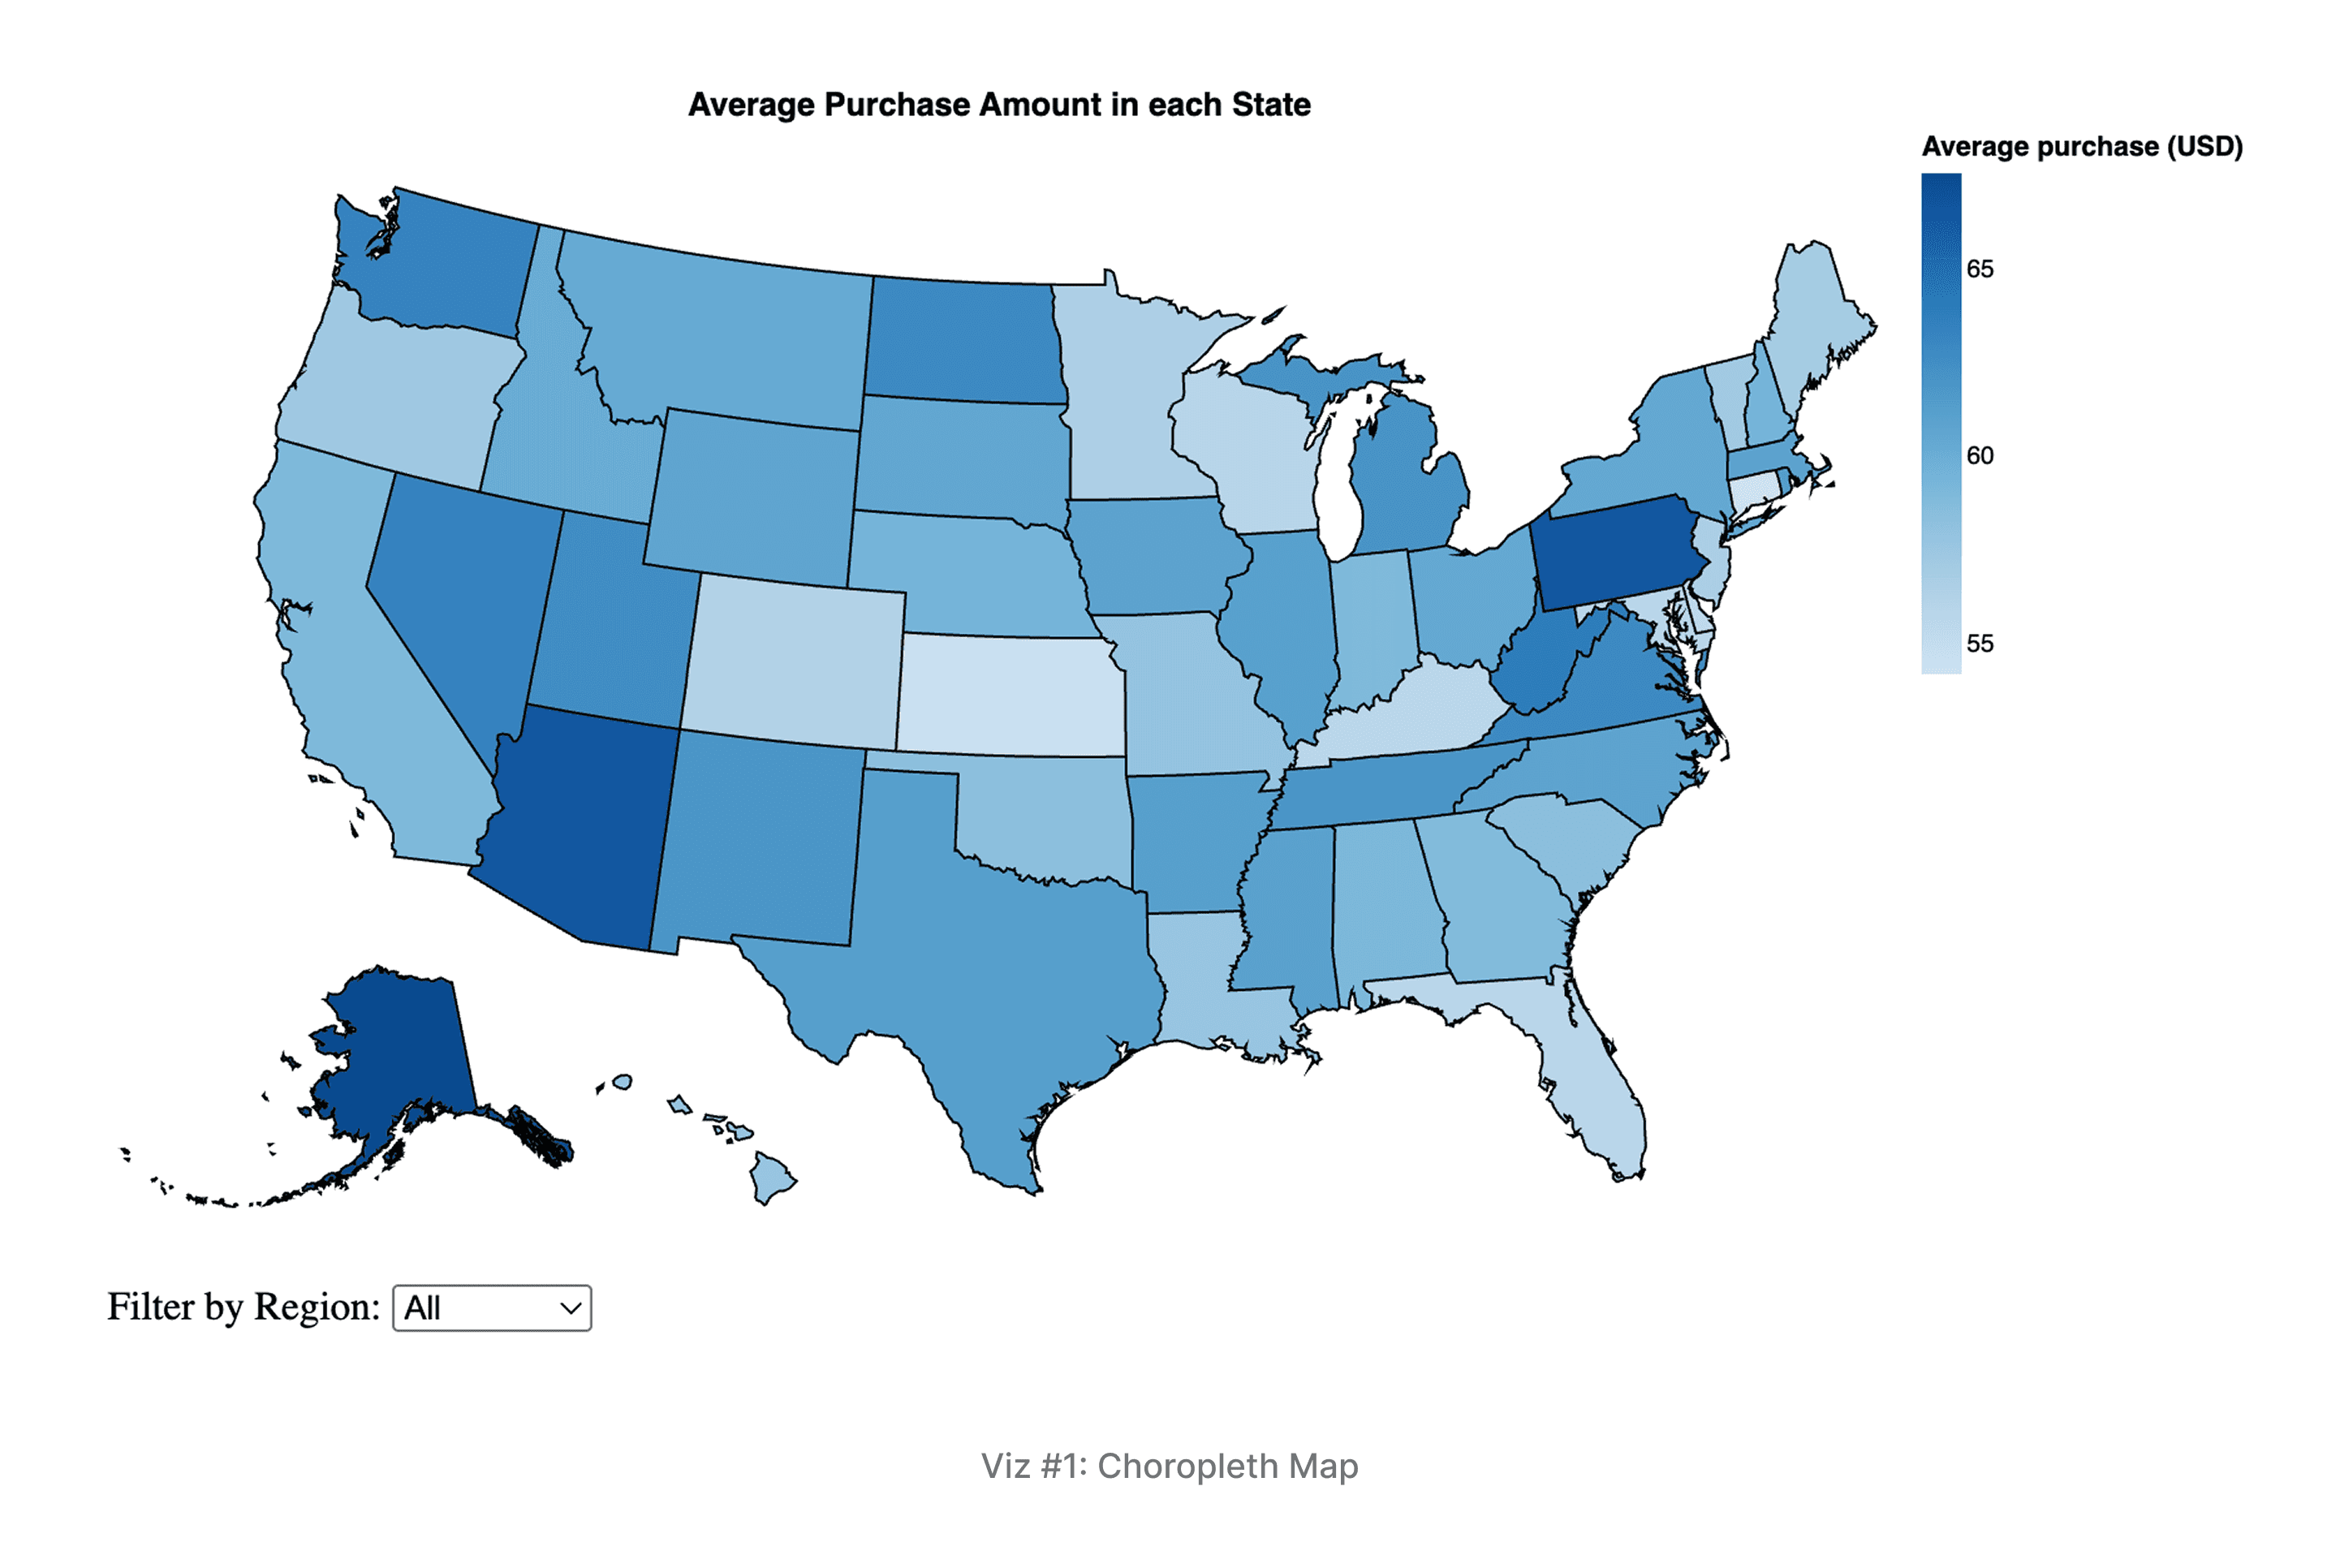
Description & Interactivity: A choropleth map using color intensity (darker blue) to encode the average purchase amount per US state. The map is interactive, allowing hover-over tooltips to display state-level metrics (e.g., average purchase, unique customers, region) and a region filter to isolate views (Northeast, South, etc.).
Key Findings: The analysis focused on the Northeast, highlighting Pennsylvania as the highest value state with an average purchase of $66.57. Massachusetts stands out as an attractive market, combining a high average purchase of $60.89 with a healthy customer base (72 unique customers).
Purchases in Different Product Categories and Seasons
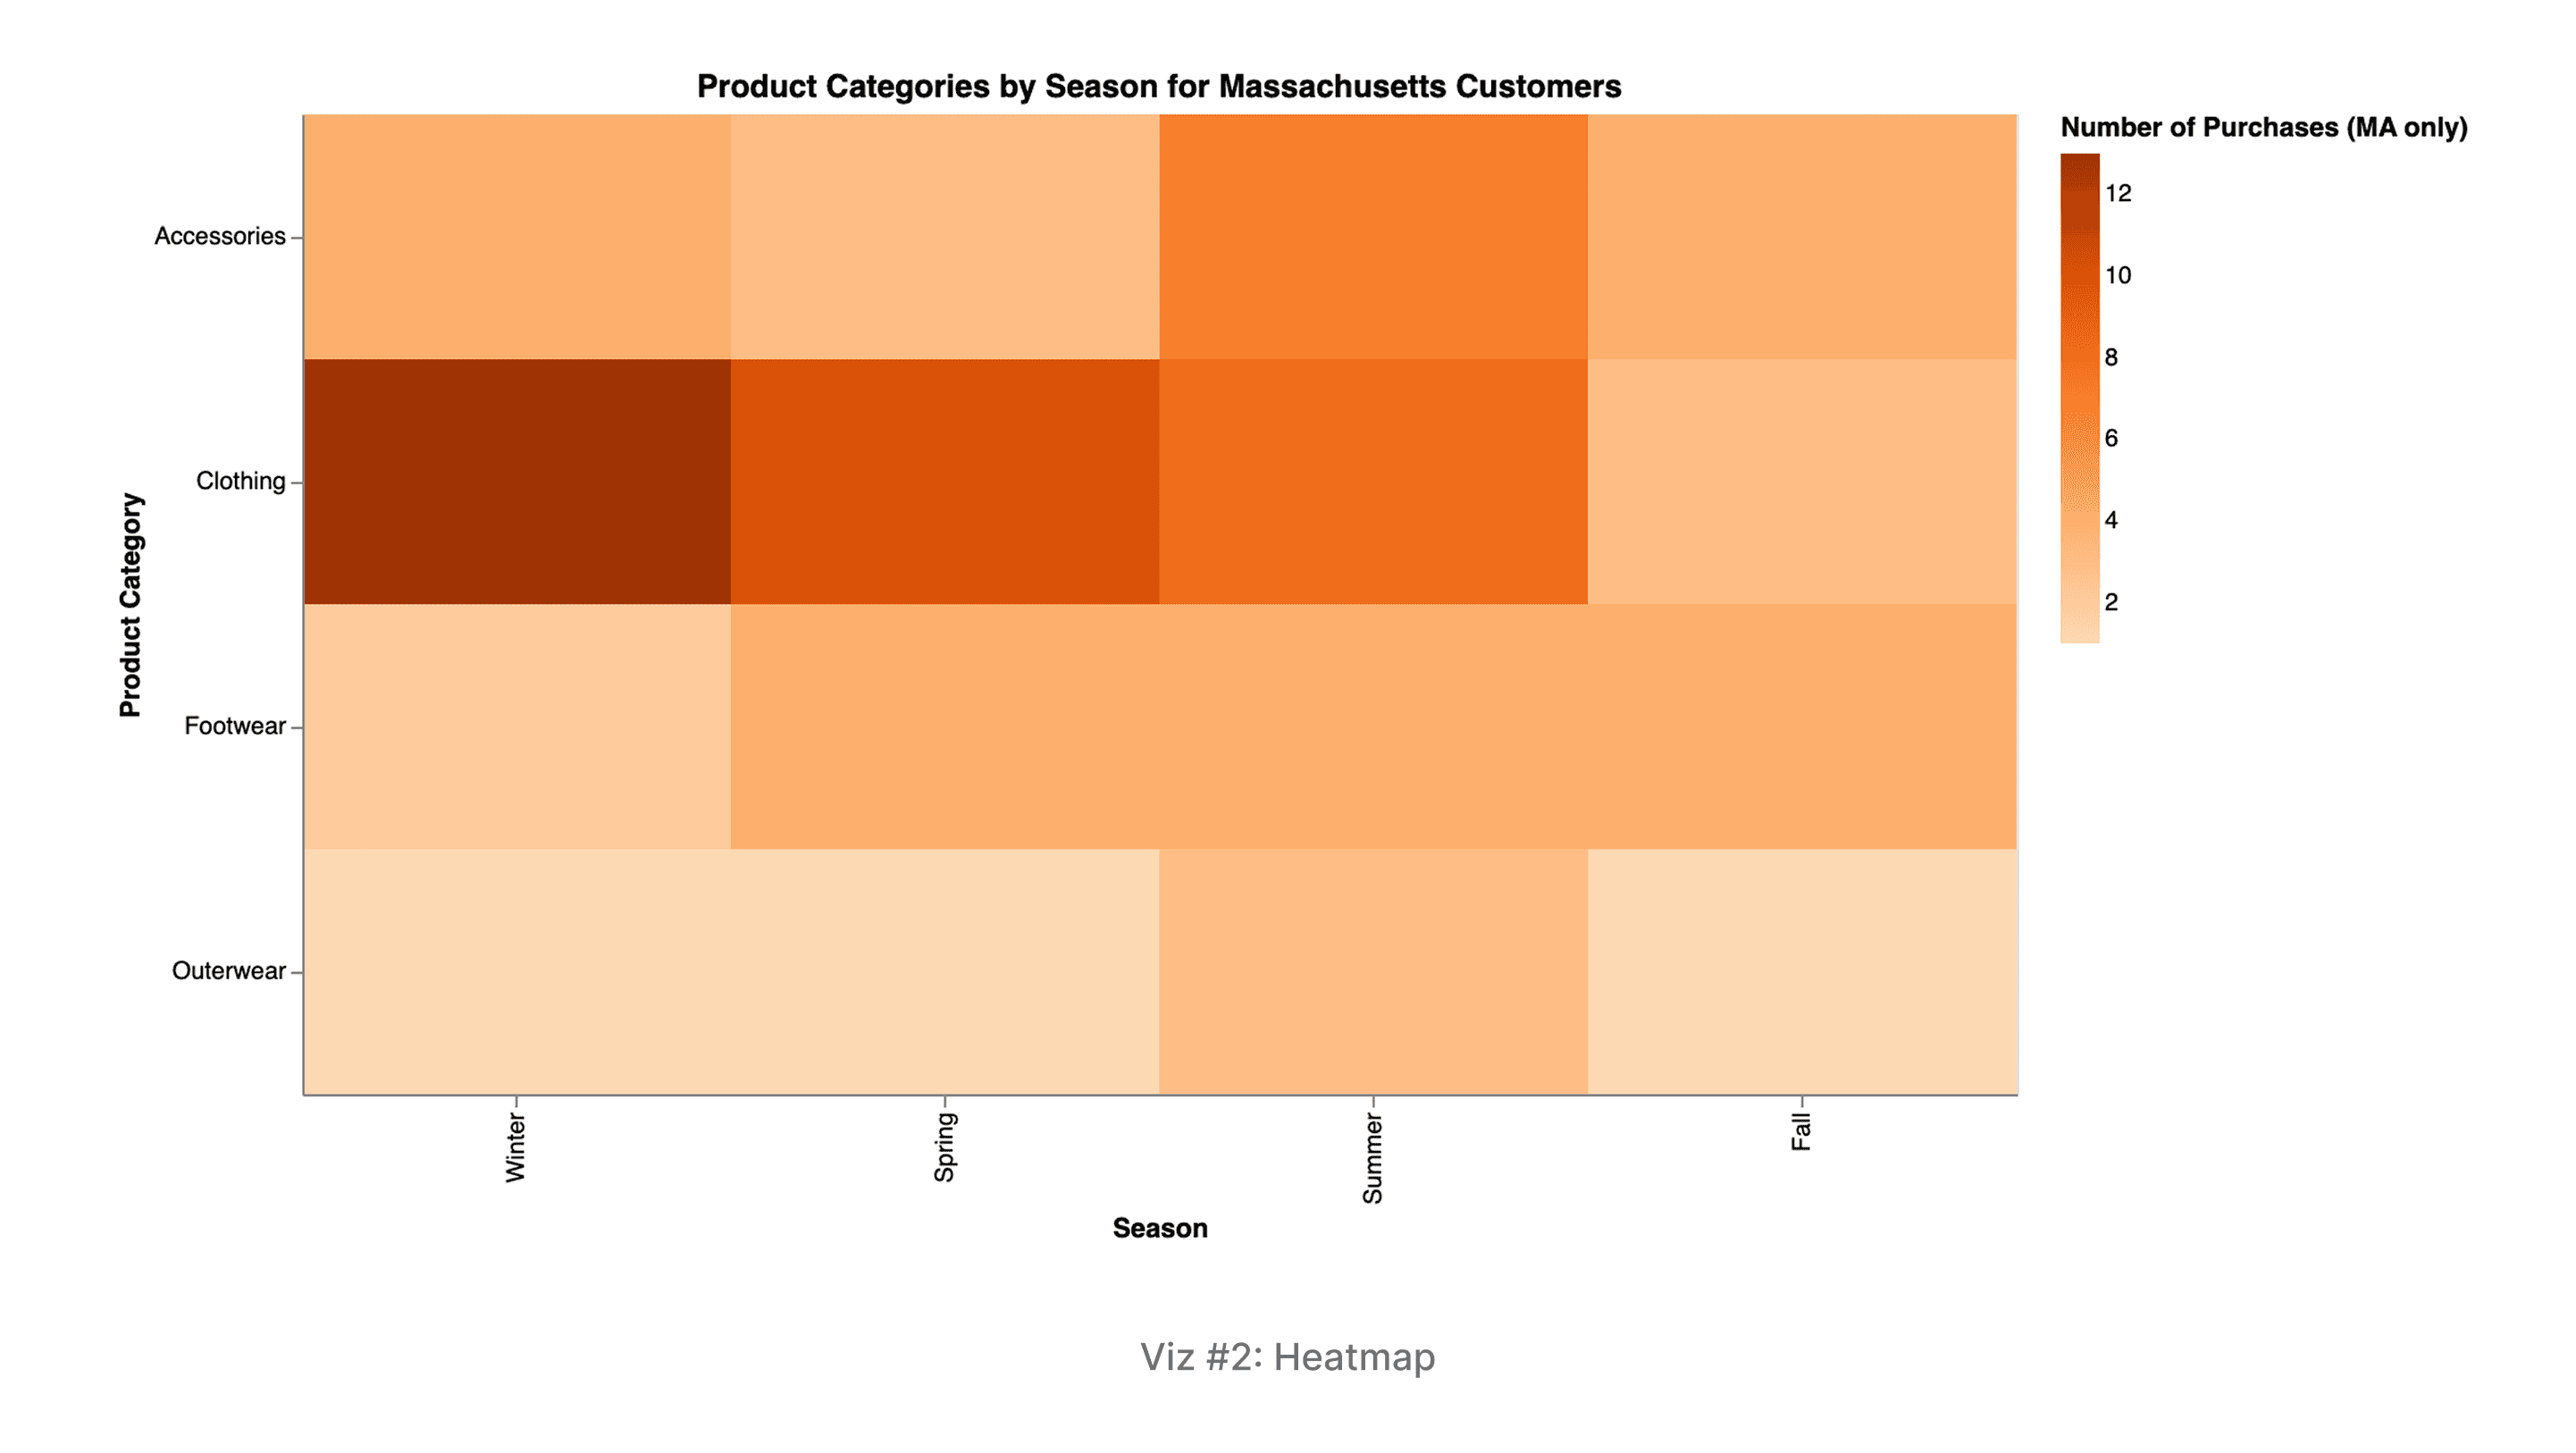
Description & Interactivity: A heatmap for Massachusetts customers comparing Product Categories (Y-axis) against Seasons (X-axis). Color intensity (deeper orange) encodes the Number of Purchases. Interactivity includes hovering to reveal the exact purchase count and the percentage of that season's total.
Key Findings: Summer is the busiest season, while Fall is the lightest. Clothing dominates demand year-round (34 total purchases). Accessories and Footwear show their highest relative importance during the Summer and Fall months, indicating clear seasonal shifts for inventory and marketing.
3. Incentives and Promos on Purchasing Amount
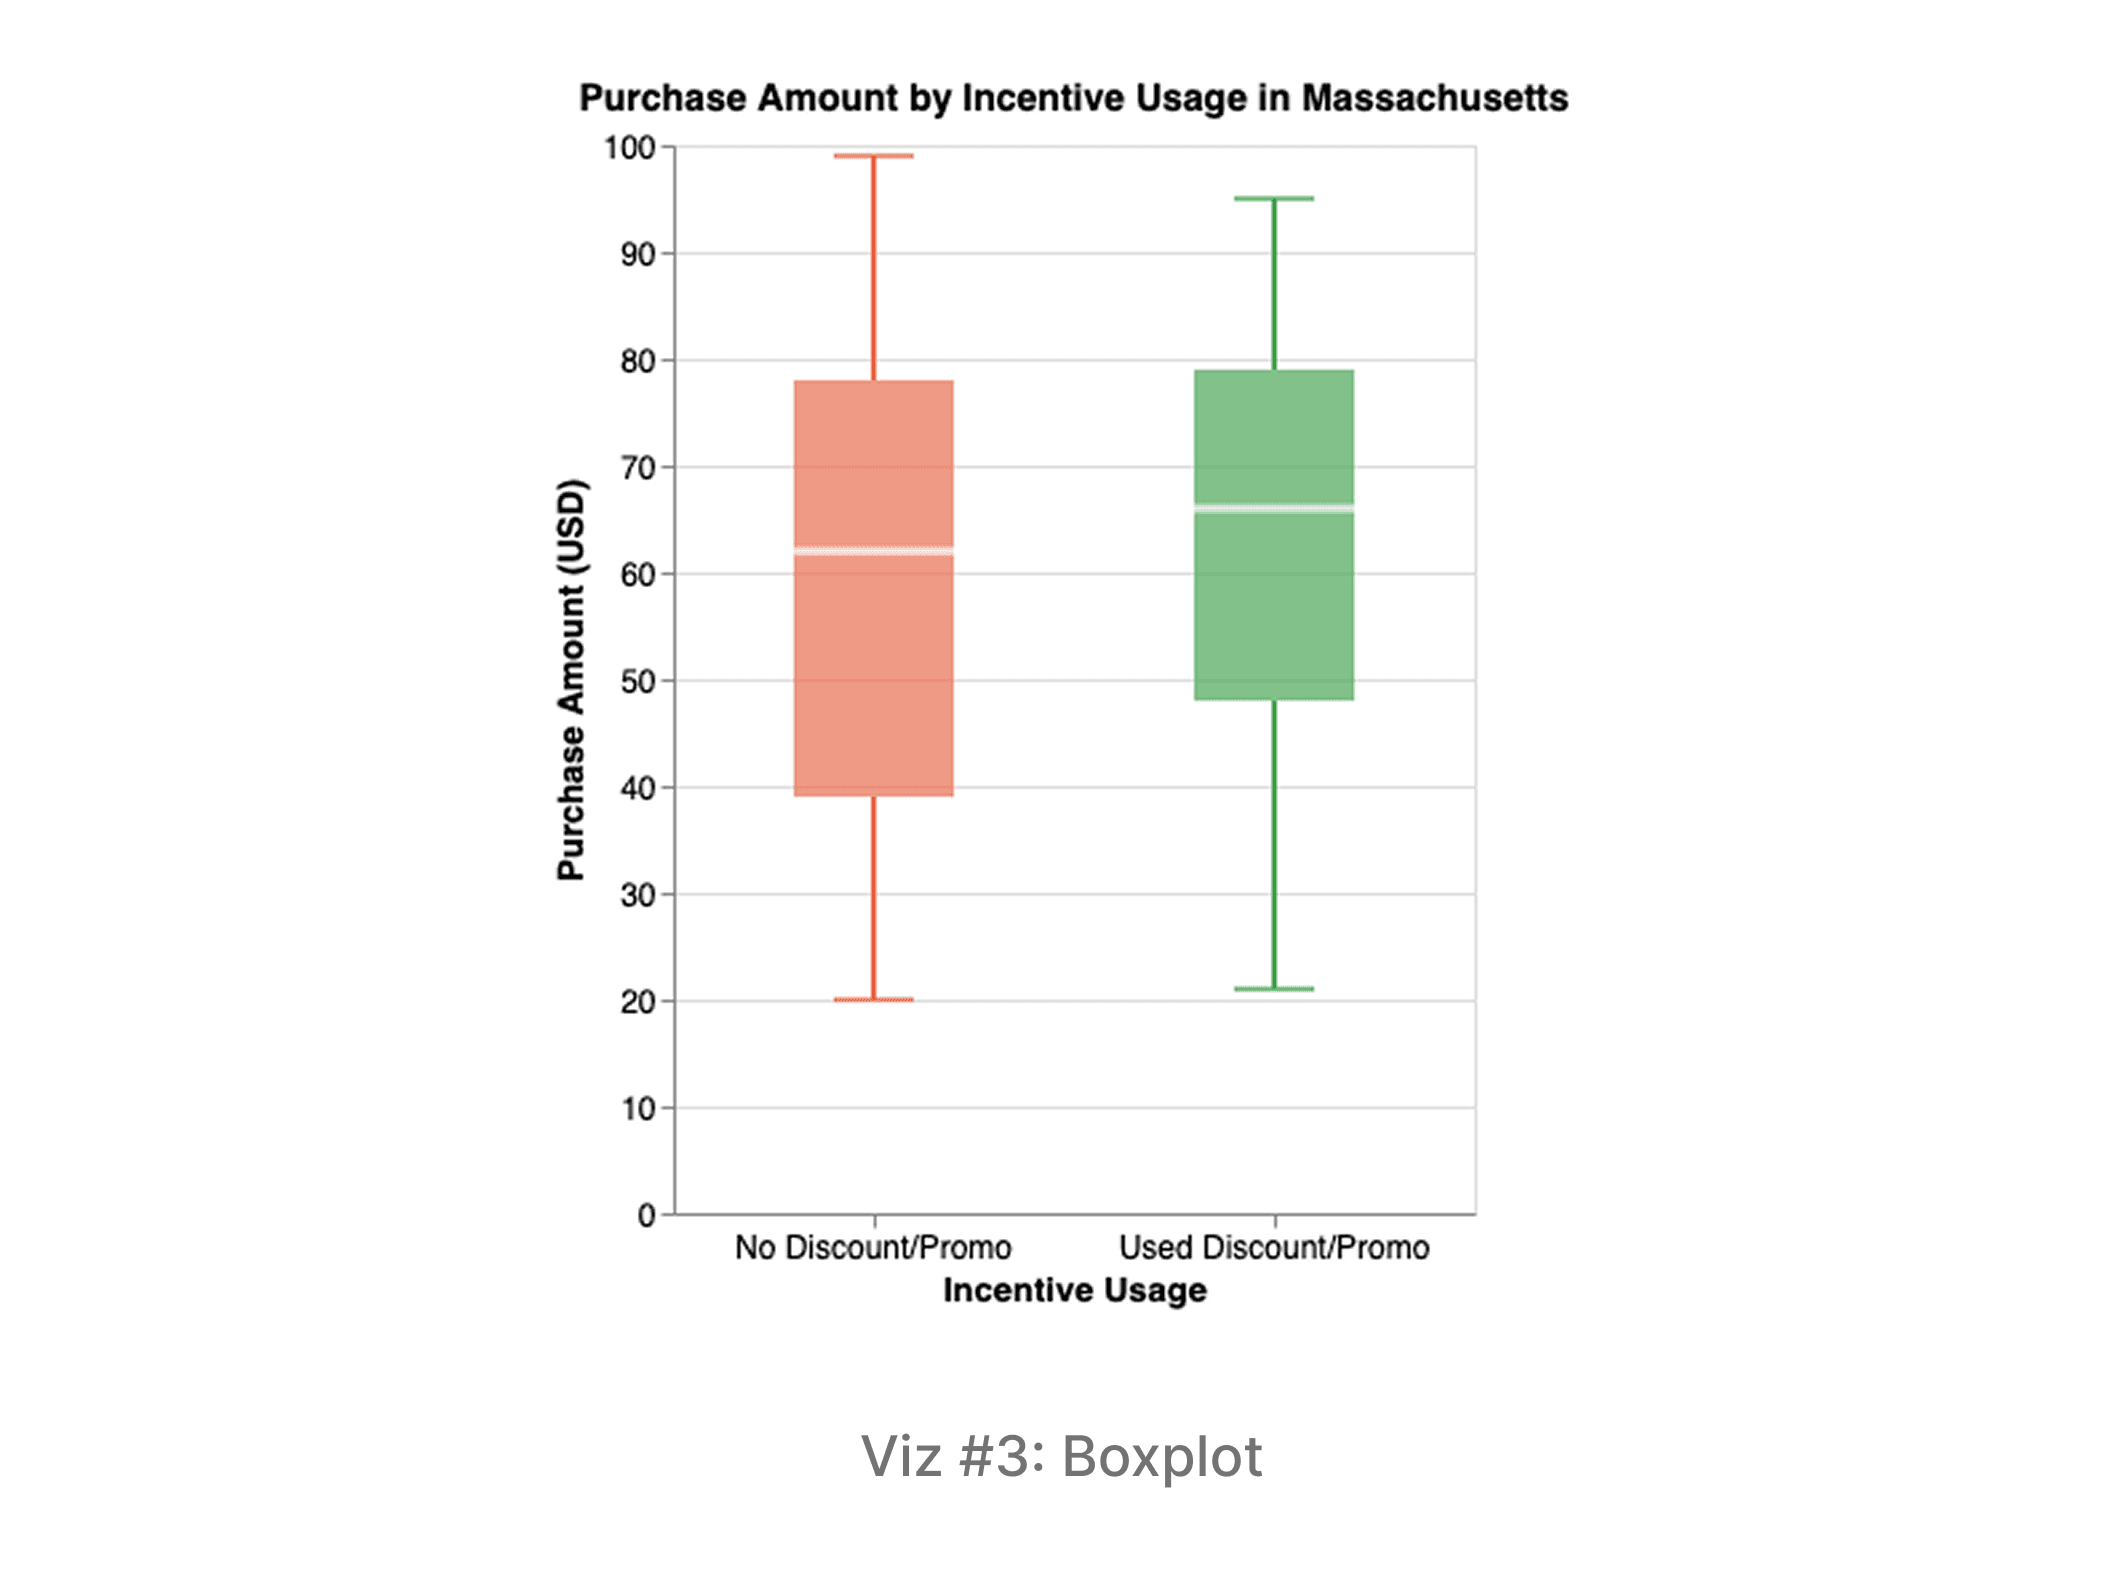
Description: A boxplot comparing the distribution of Purchase Amounts between two groups: customers who used a Discount/Promo and customers who Used Neither. The box length, internal line, and whiskers visually represent the distribution, variability (IQR), and median spending for each group.
Key Findings: Customers who used an incentive spent slightly more on average and demonstrated more consistent spending (lower standard deviation). This suggests that incentives have a small but positive effect on increasing transaction value and consistency.
Purchase Amount by Gender & Age Group
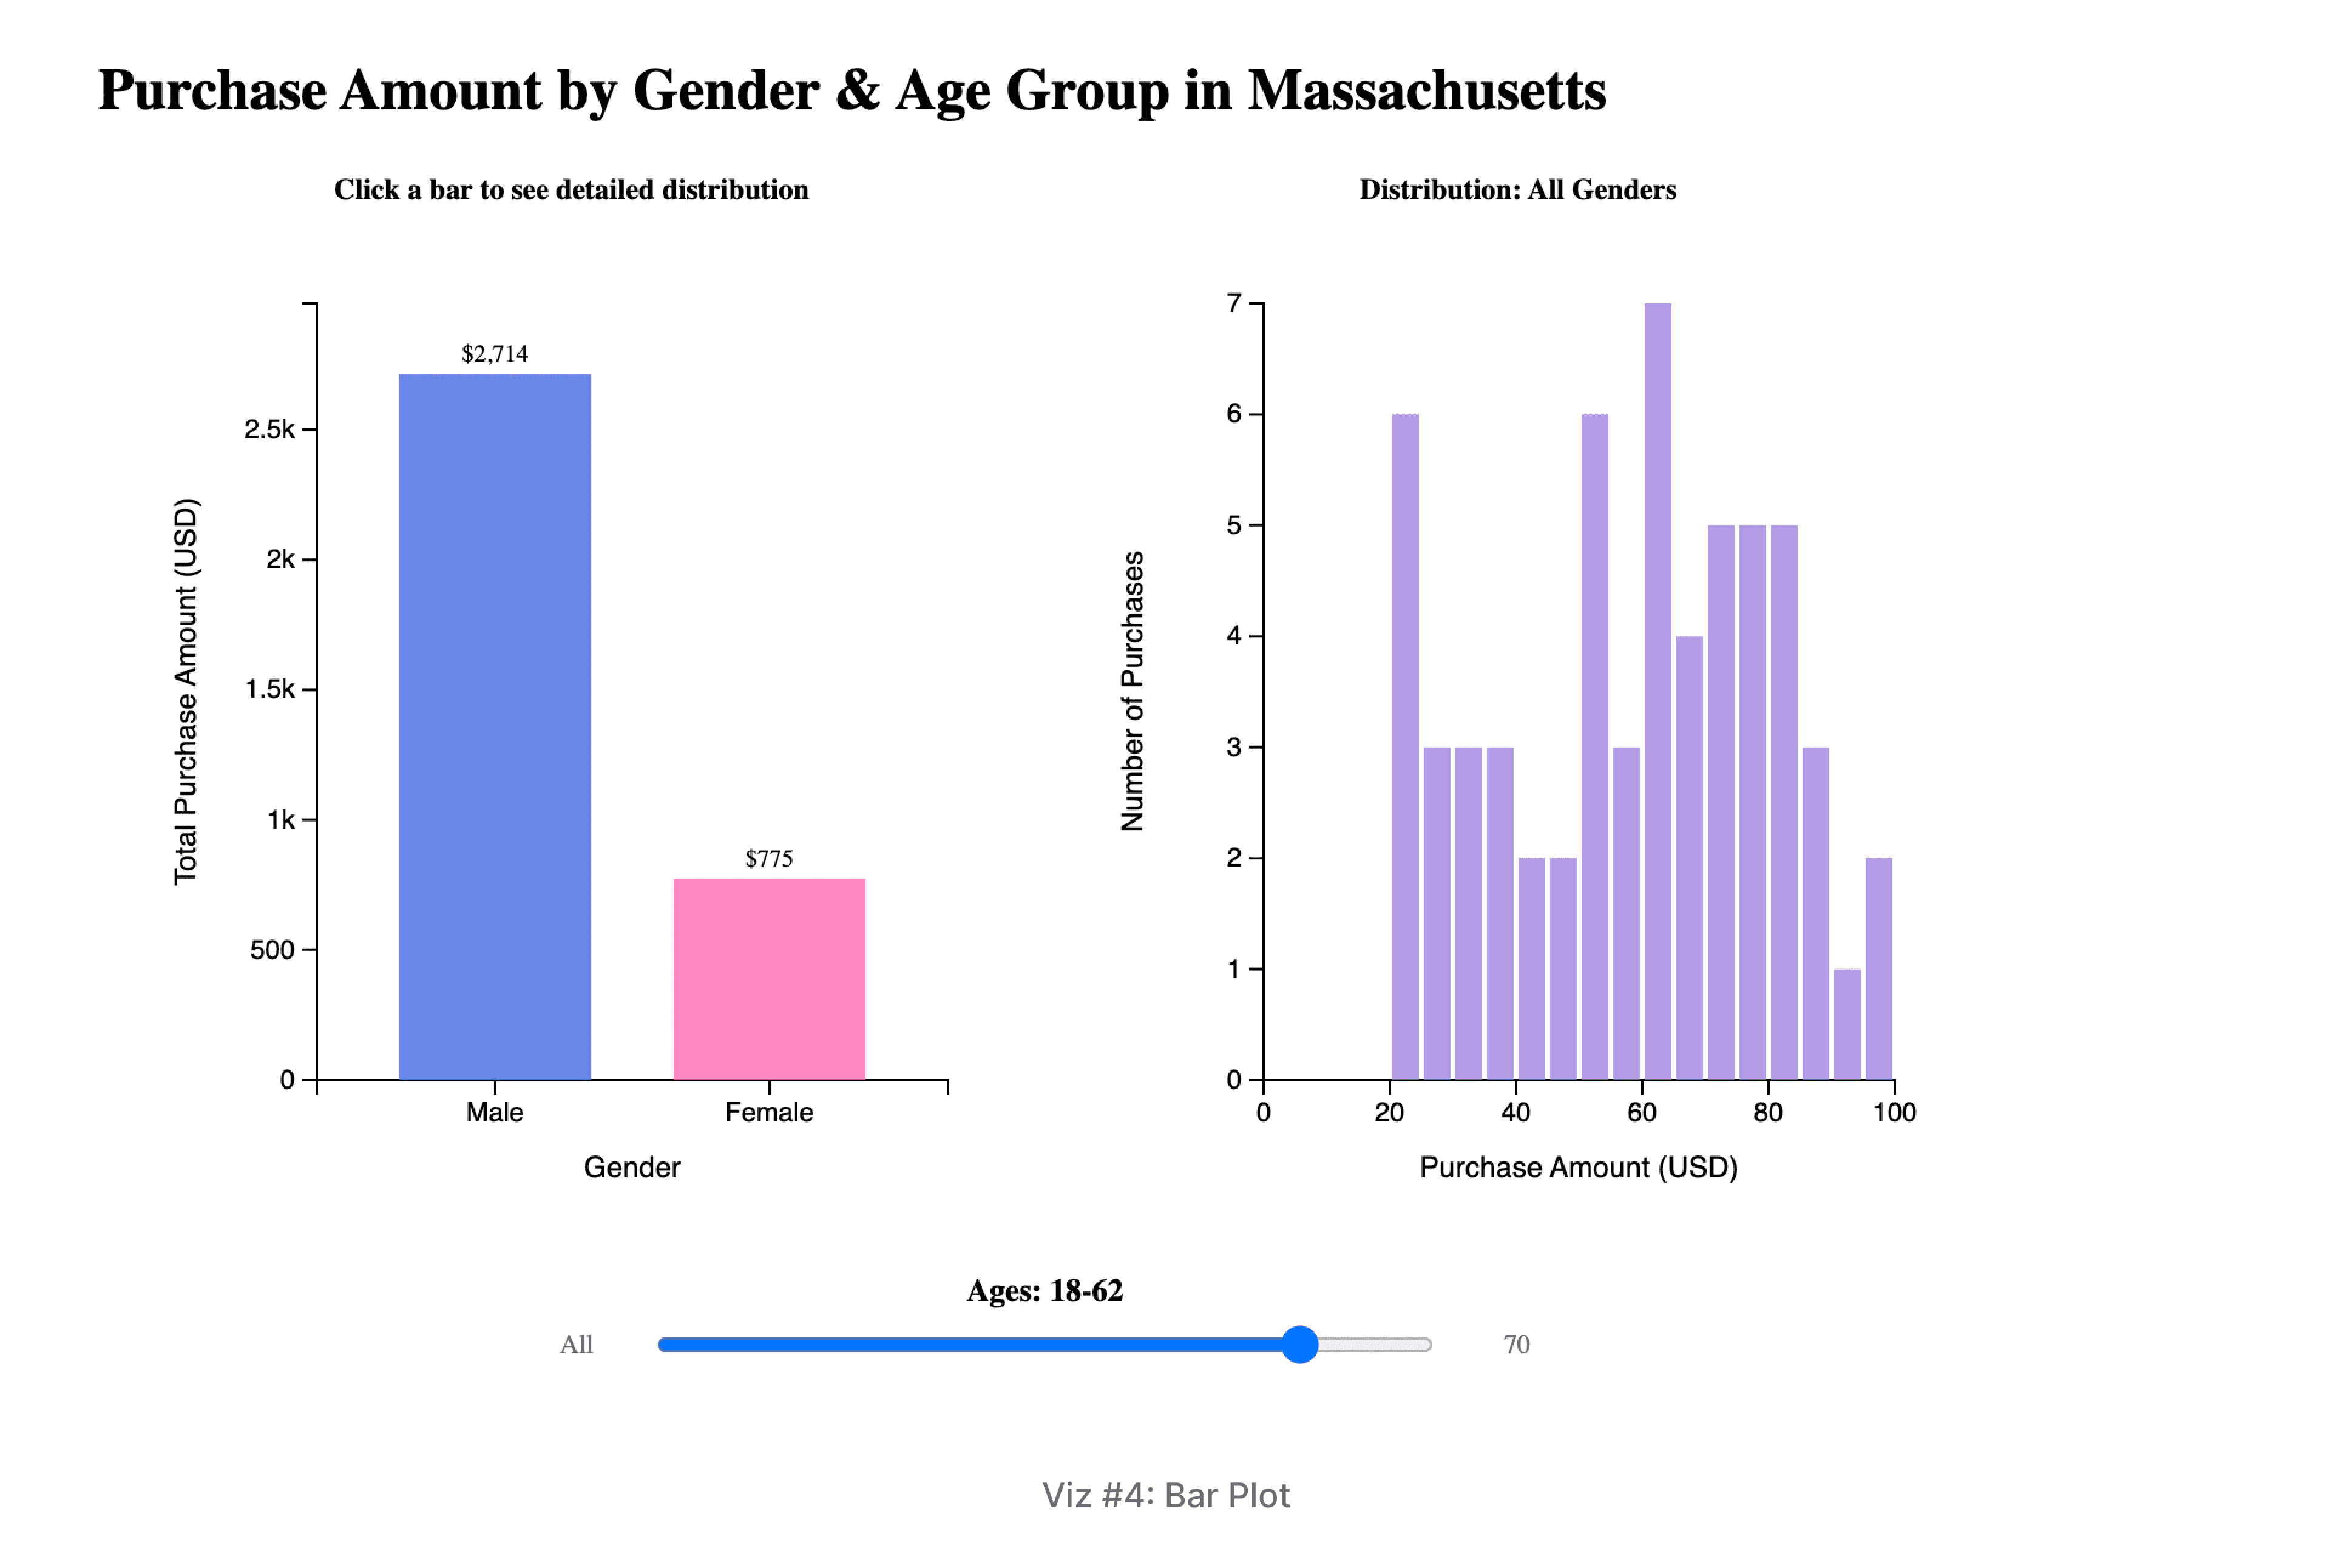
Description & Interactivity: A bar chart visualizing total purchase amounts by gender in Massachusetts. The Y-axis encodes the total purchase amount. The visualization features a continuous age slider that allows users to set a maximum age threshold, providing a cumulative view of spending across different age cohorts.
Key Findings: Men consistently outspend women across every age category. Overall spending shows an upward trend with age, peaking in the 61-70 male demographic. This highlights older males as the highest-value target group.
Size Distribution by Category
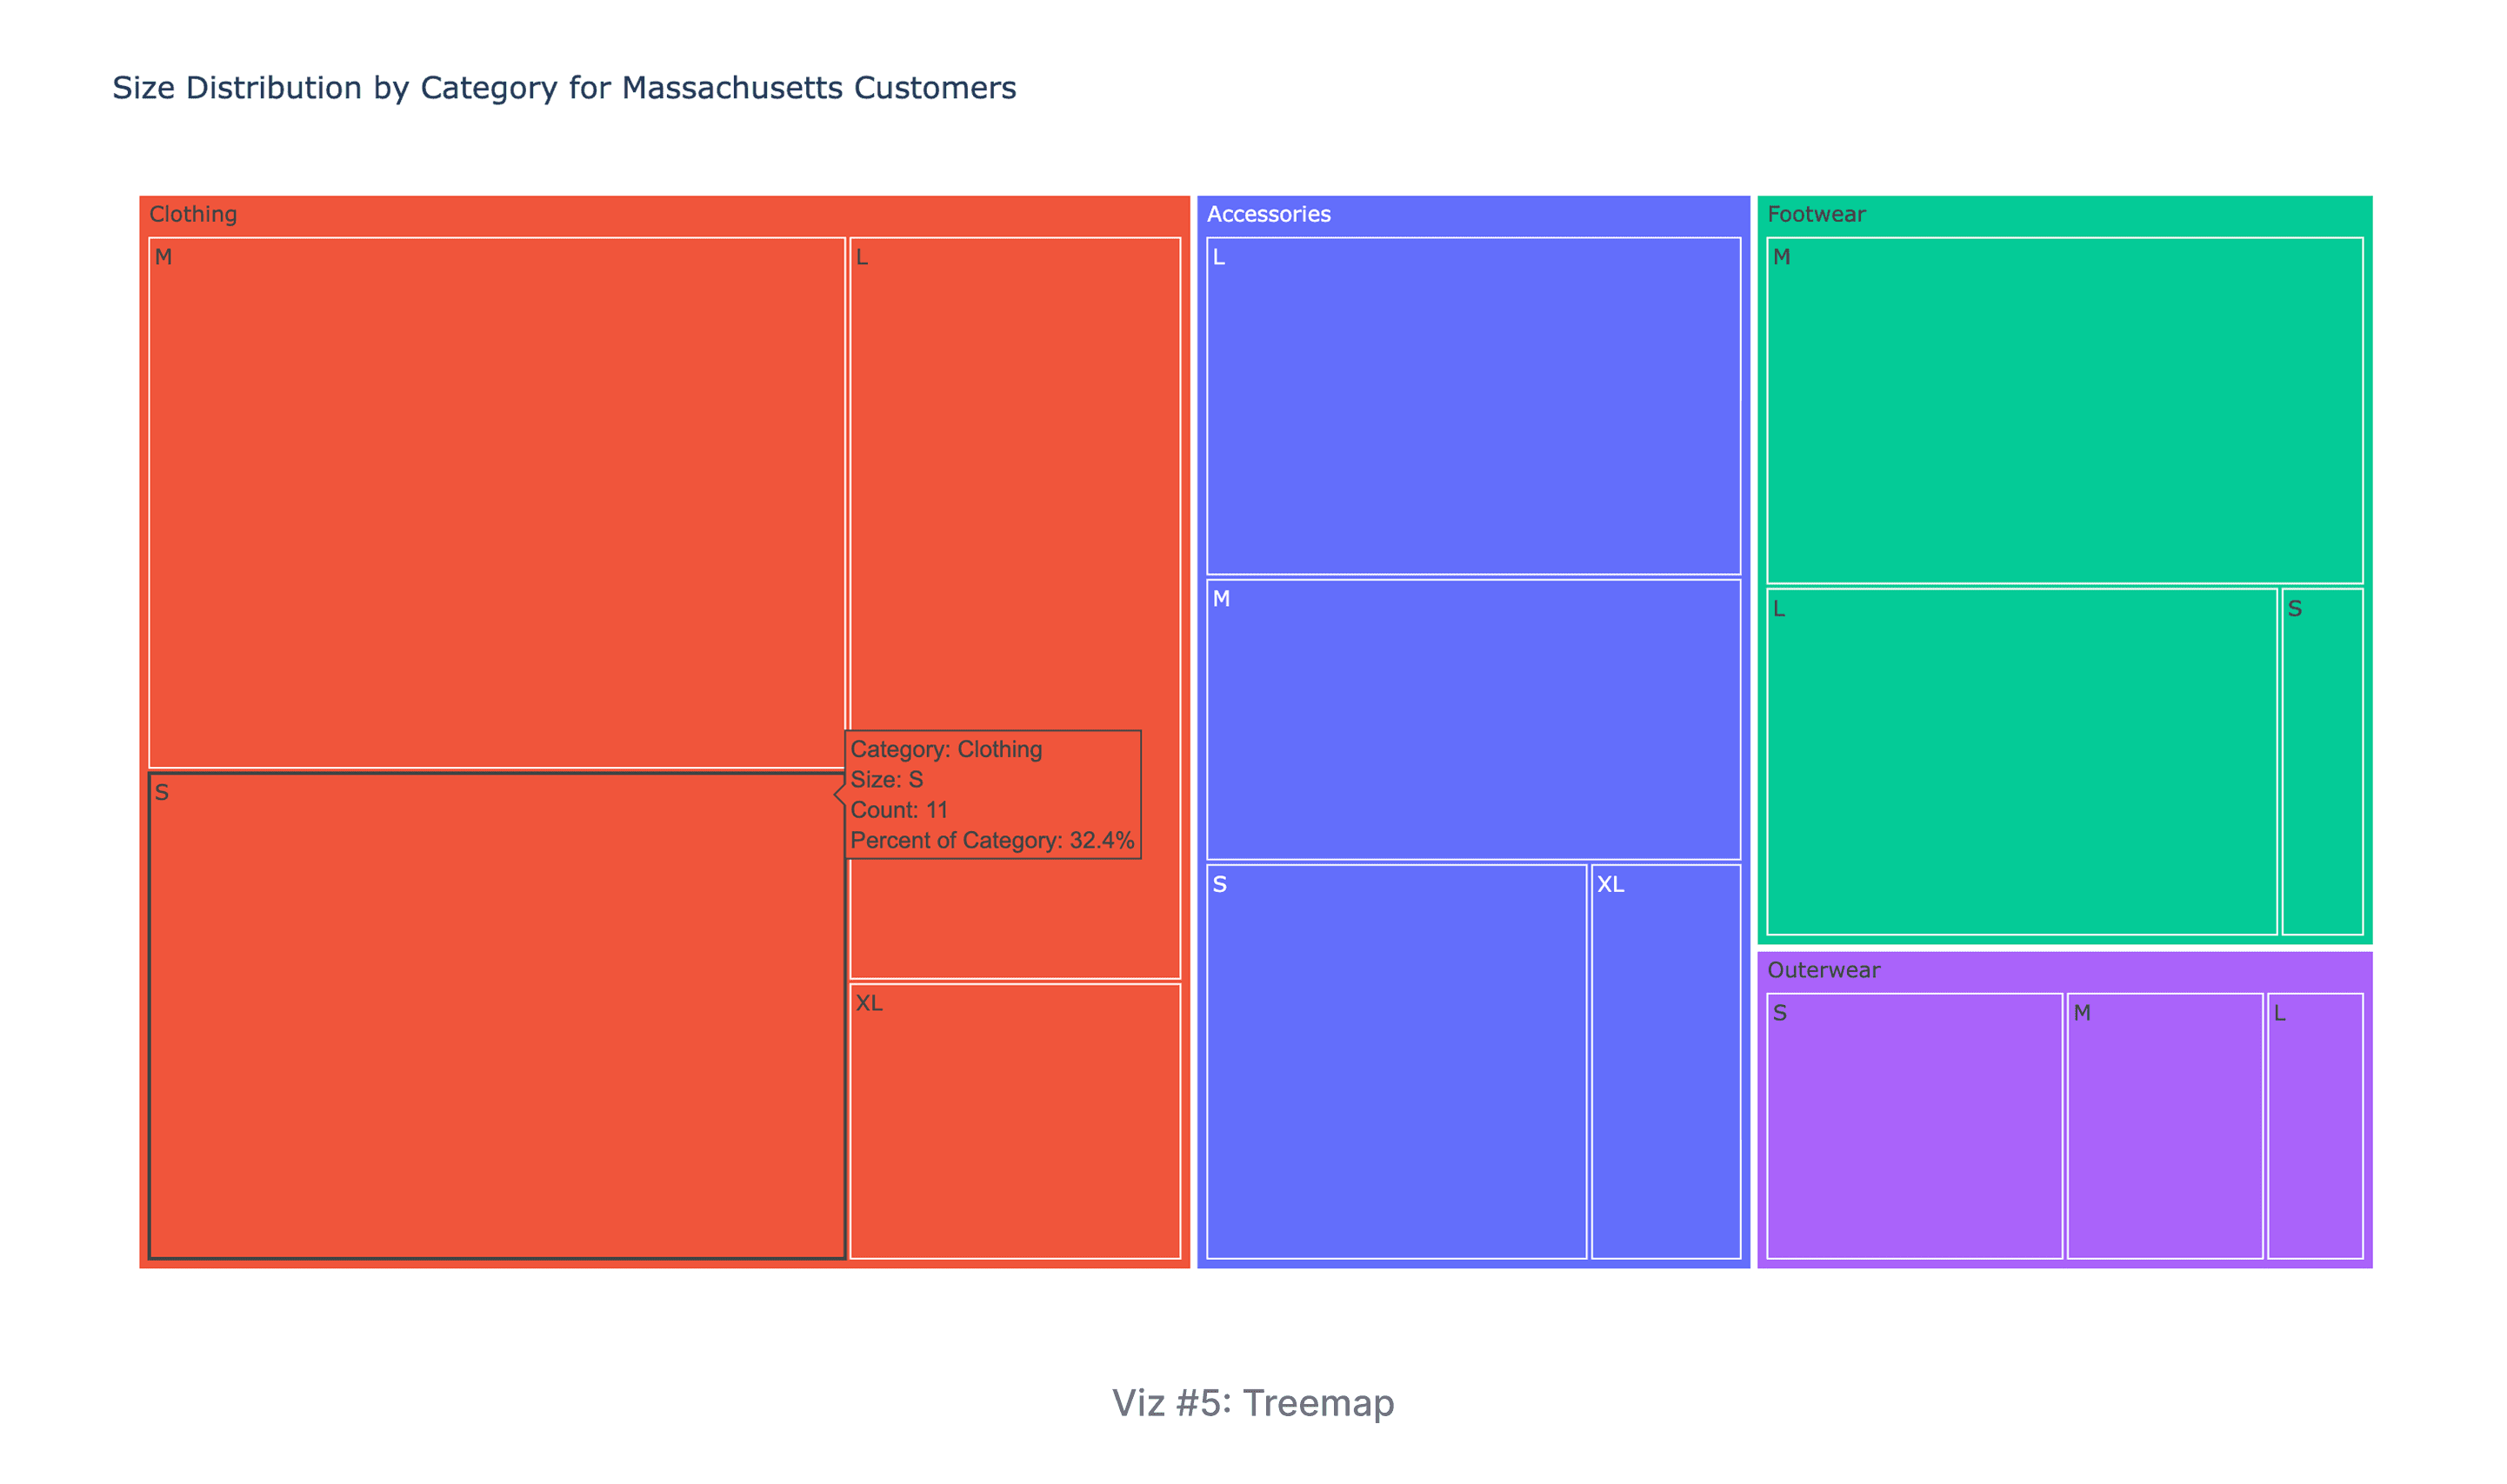
Description: A treemap showing how size purchase counts are distributed within each product Category. The area of the nested rectangles encodes the number of purchases for a specific size/category combination, and color is used to distinguish the product categories.
Key Findings: Medium is the consistently most popular size across all categories, followed by Large, indicating it should be the top priority for inventory. Clothing has the highest volume overall, with Medium and Small being its most common sizes.
Why this Analysis Matters
Our analysis of shopping behavior reveals three critical insights for targeting the right customers and managing inventory effectively in Massachusetts.
Target Demographics: Prioritize Older Men
Massachusetts shoppers spend consistently year-round, averaging $61 per purchase. Our data shows that men spend more than women across all age groups, peaking in the 61–70 age bracket. To maximize revenue, products should be targeted specifically at older male shoppers. Also, this means premium products and targeted promotions should focus on older male shoppers, while discounts can help engage younger customers and women.
Inventory: Seasonal Shifts and Medium Sizes
Clothing dominates sales year-round. Accessories spike in the summer, reaching 32% of purchases, and in the fall, Accessories and Footwear gain equal importance alongside Clothing. Retailers should maintain high stock levels of Clothing but increase inventory for Accessories in summer/fall and for Footwear in the fall. Medium sizes are the most popular across all categories and should be prioritized in ordering decisions.
Discount Effectiveness: Work, but aren't Everything
Customers using discounts spend slightly more ($62 vs $60) and more consistently. While the impact is not huge, promotions do encourage higher spending. This makes discounts useful for attracting price-sensitive shoppers, especially younger customers and women, but they shouldn't be the only strategy for driving sales.
Future Work
A next steps could be to expand the scope beyond Massachusetts by comparing shopping behavior across different U.S. regions (Northeast, South, Midwest, West) to uncover regional differences in spending, seasonal preferences, and discount usage. Second, we could advance the analysis using predictive modeling and machine learning. This will involve using features like demographics, purchase history, and incentive use to build models that can forecast key metrics such as a customer's purchase amount, preferred product category, and likelihood of using a discount for more precise inventory planning and personalized marketing strategies.
What I Learned
This project taught me how important it is to shape a clear story before building visualizations. Although the dataset includes the entire United States, we chose to focus on Massachusetts because there were clearer trends versus looking at the entire country and wanted our analysis to reflect a place we understand personally.
In creating the visualizations, I saw how effective Pandas, Altair, and D3 become in organizing the data in a way that supported meaningful visual questions, building clear and polished charts, and adding interactive elements like filters, hover highlights, and sliders. Using all three tools showed me how interactivity can completely change the viewer’s experience, helping identify and letting people explore the data on their own. Overall, I learned that the tools I choose and the design choices I make play a huge role in turning raw information into a story that feels clear, engaging, and easy to understand.